Flow Vis Testing of OBR26
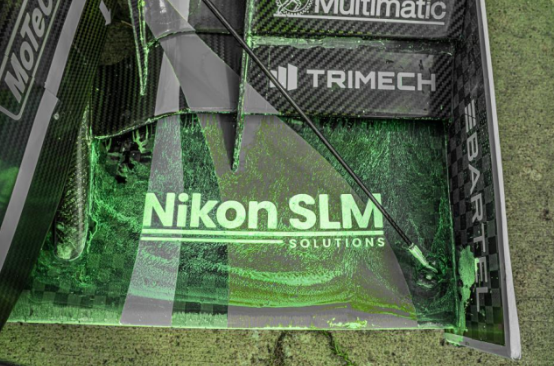
By applying flow vis paint to the Front Wing of OBR26 during acceleration testing and comparing it to CFD results we were able to validate our simulation model and determine one area where it was lacking accuracy.
Project write-up
The main aim was to compare the real flow behaviour with our CFD predictions and identify areas of separation and boundary layer behaviour that are difficult to validate from simulation alone.
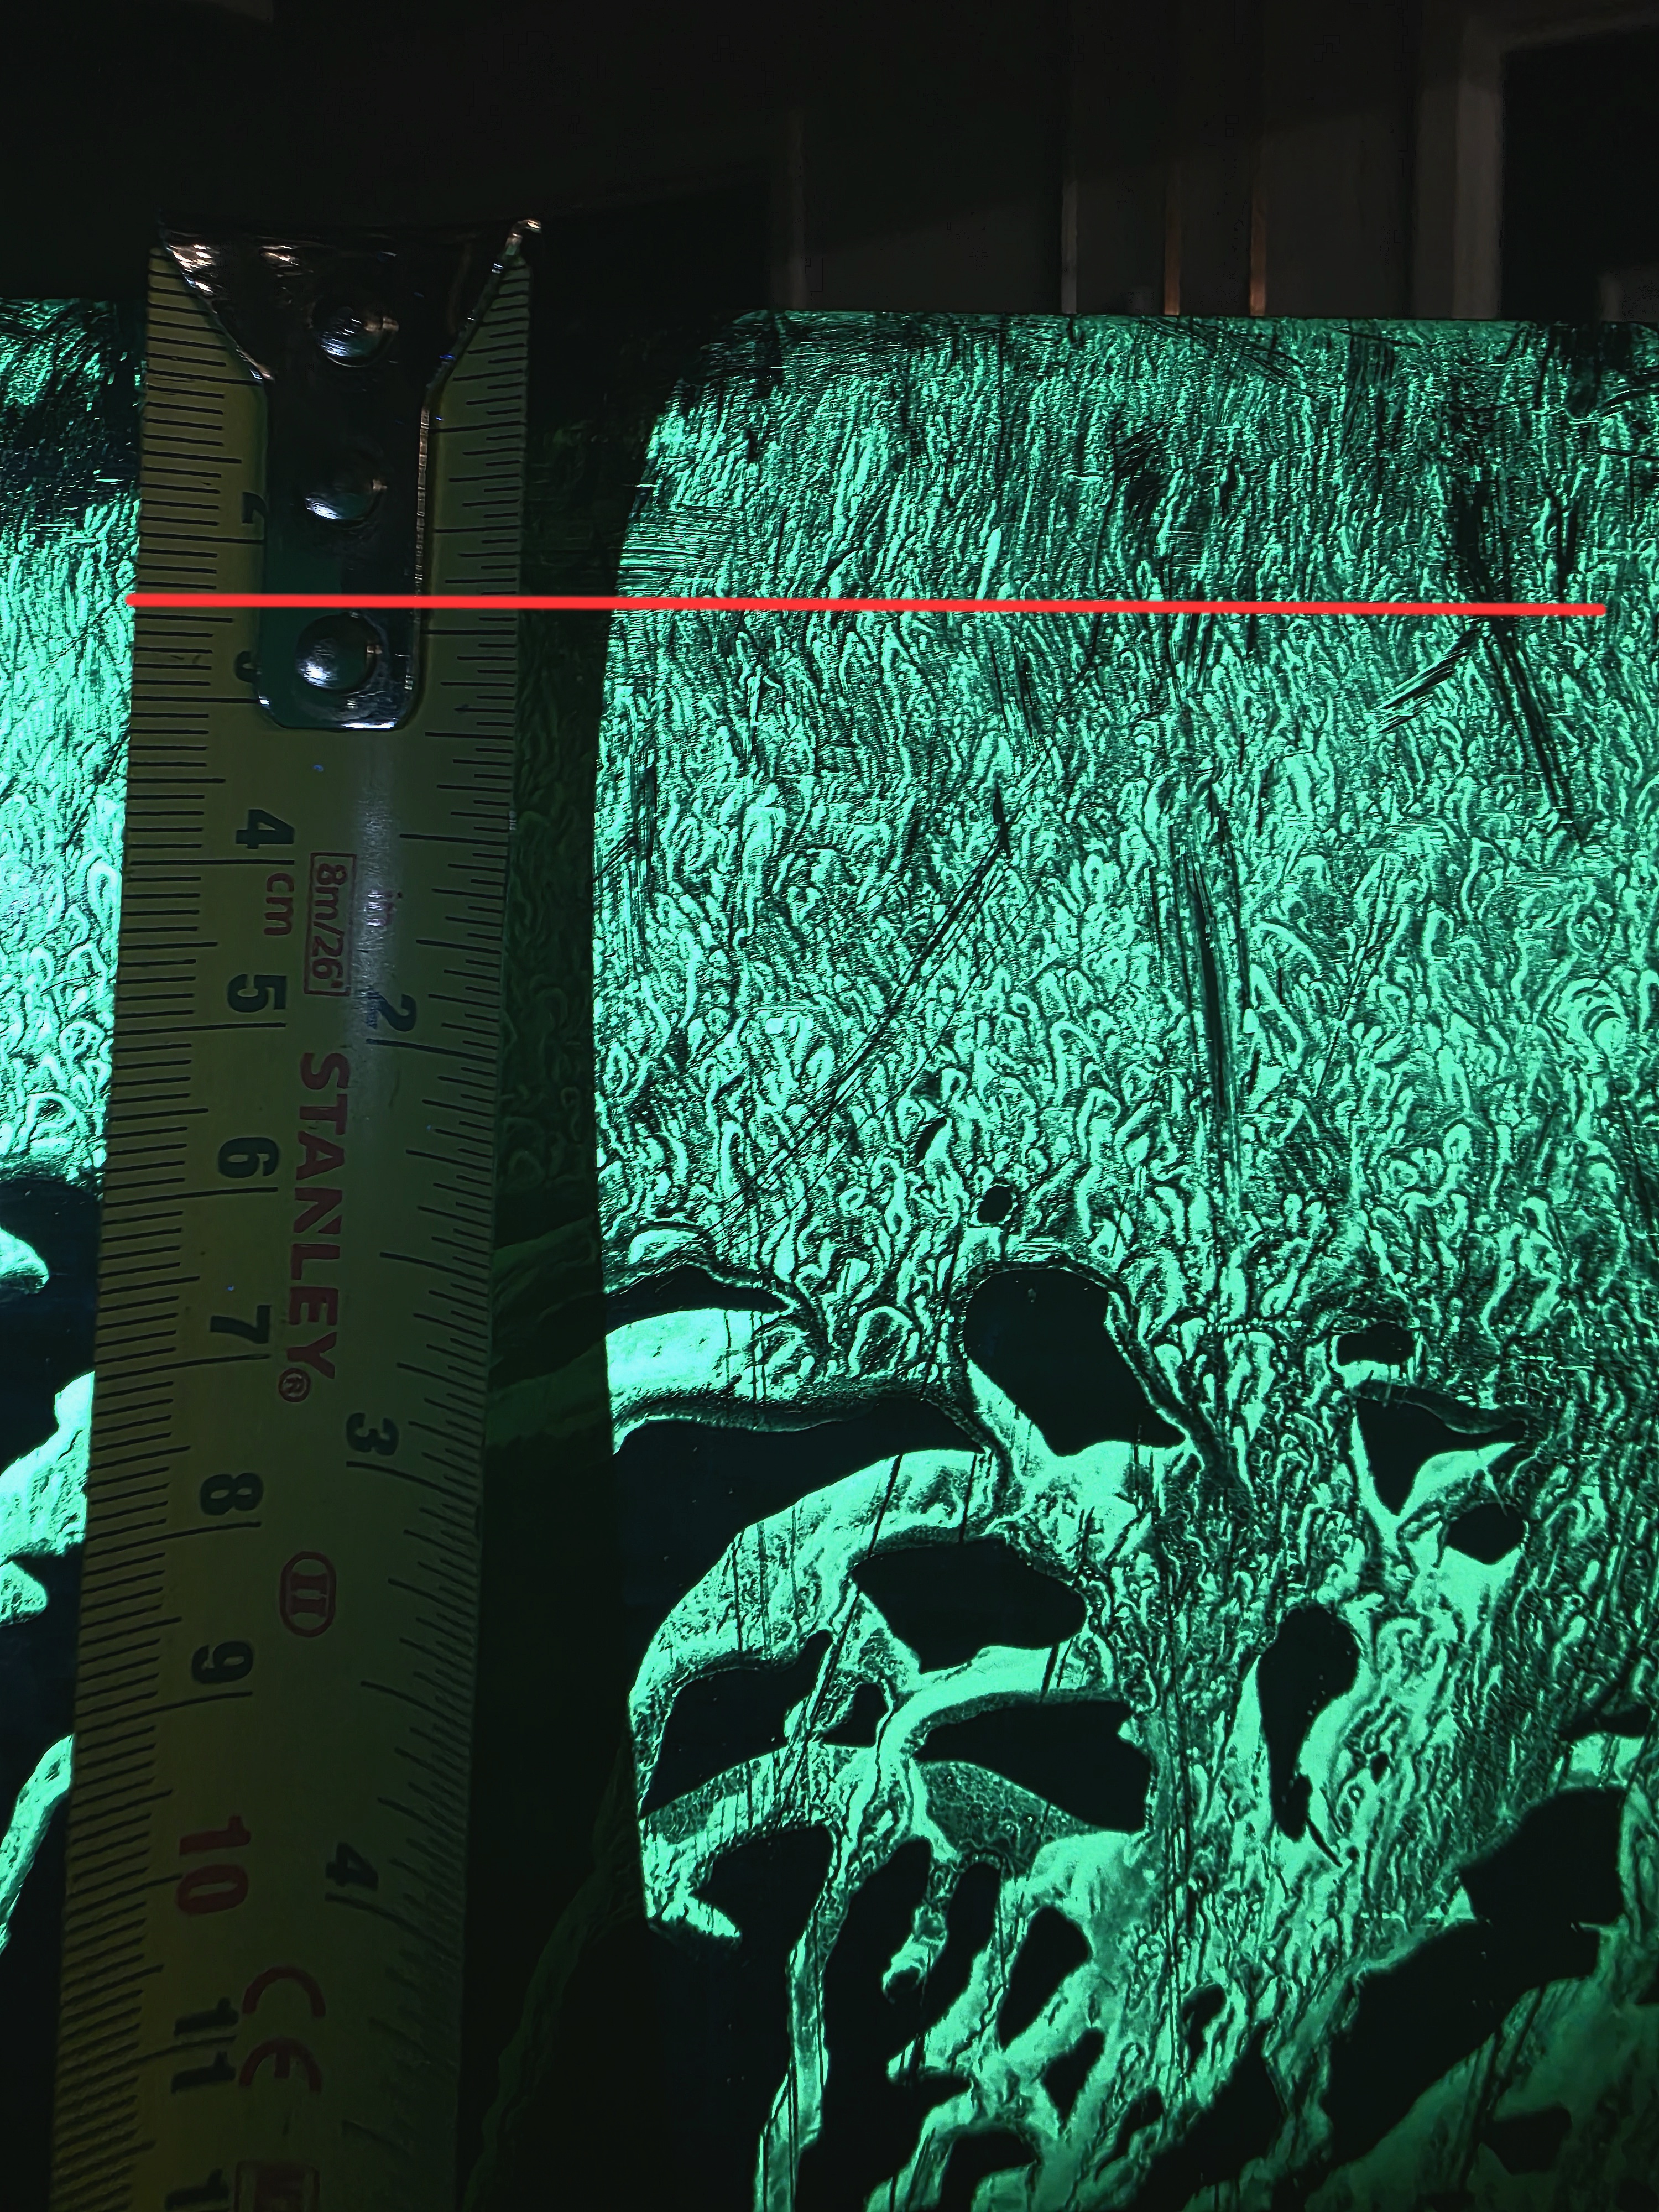
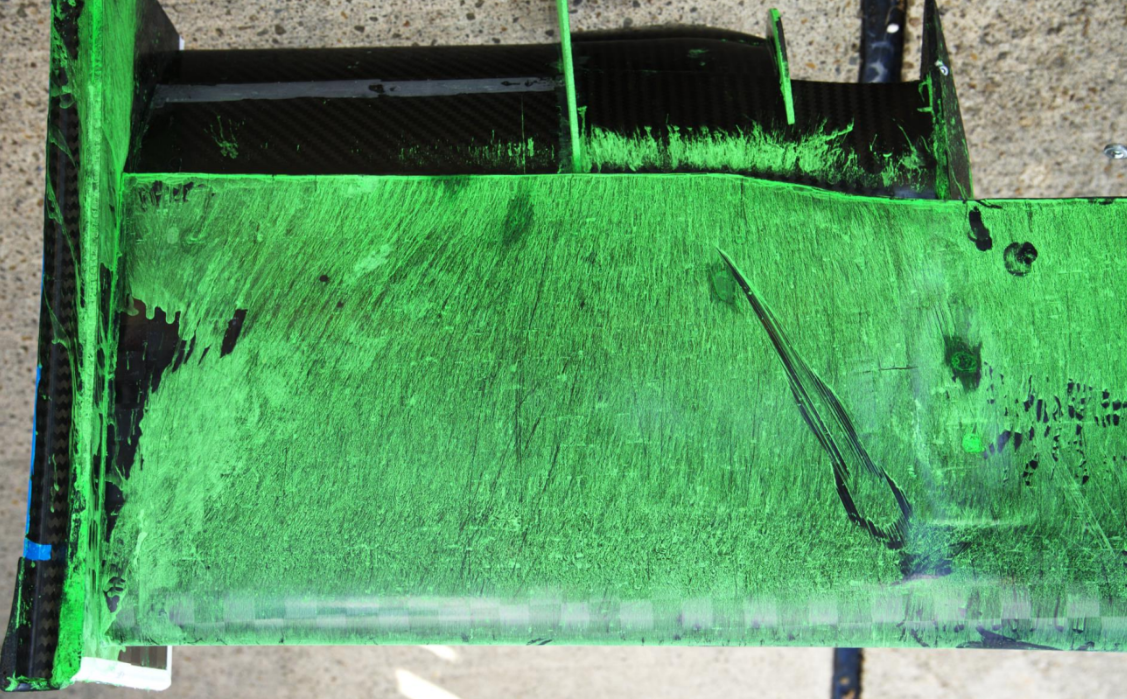
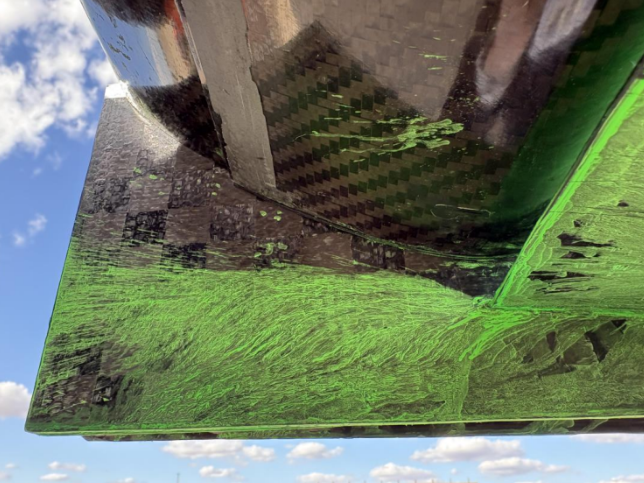
We applied flow-vis paint mainly to the front wing and ran the car through acceleration and autocross tests. One of the clearest findings was significant separation on the high-pressure side of the front wing, especially compared with our nominal ride-height CFD case.
During the highest-speed acceleration runs the car was also pitching heavily, meaning the actual aerodynamic condition was quite different from the straight-line CFD setup. This gave us a useful direction for further correlation work, particularly running CFD at representative pitched ride heights.
Another interesting result was a clearly visible and repeatable boundary-layer transition line on the wing. The position was consistent across testing on two different days, although it occurred considerably earlier than a simple Reynolds-number calculation suggested. The wing also separated earlier than the CFD simulation result with gamma transition modelling. Local flow acceleration and the relatively high atmospheric turbulence during testing were likely important factors.
Interactive comparison
Endplate vortex
Drag to compare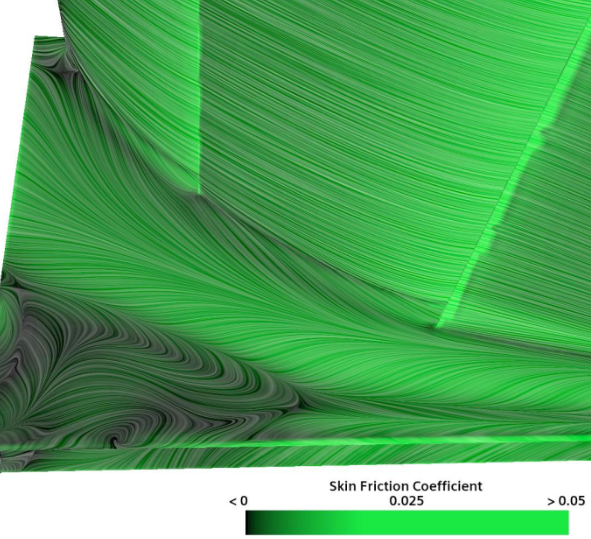
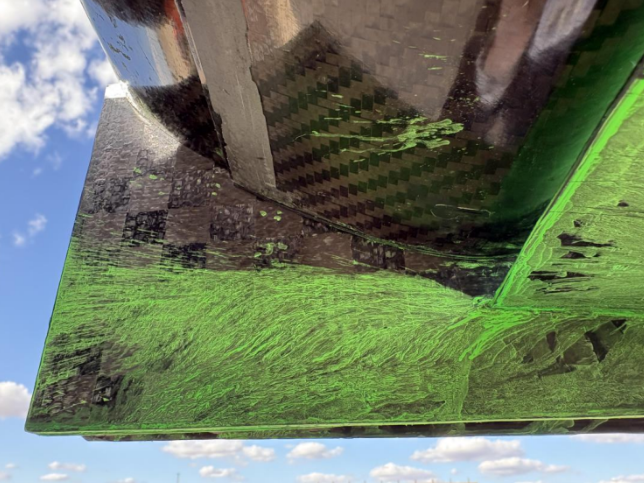
FW Mainplane High Pressure side
Drag to compare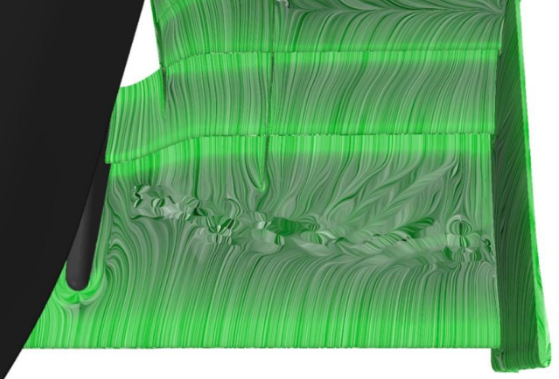
Images